GLS MAPS
Tuesday, November 19, 2013
Scatter Plot
https://www.meted.ucar.edu/sign_in.php?go_back_to=http%253A%252F%252Fwww.meted.ucar.edu%252Fhydro%252Fverification%252Fintro%252Fprint_version%252F04-Correlation.htm##
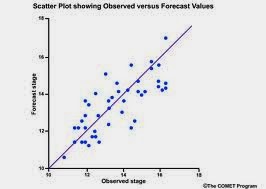
Scatter plots are a type of mathematical diagram that uses cartesian coordinates to display values from to variables fro a set of data. There is a trend line often noted with computing the general relationship between the variables.
No comments:
Post a Comment
Newer Post
Older Post
Home
Subscribe to:
Post Comments (Atom)
No comments:
Post a Comment